Jennifer Su & Victoria Branco DaSilva
When Can I Swim In The Lake?
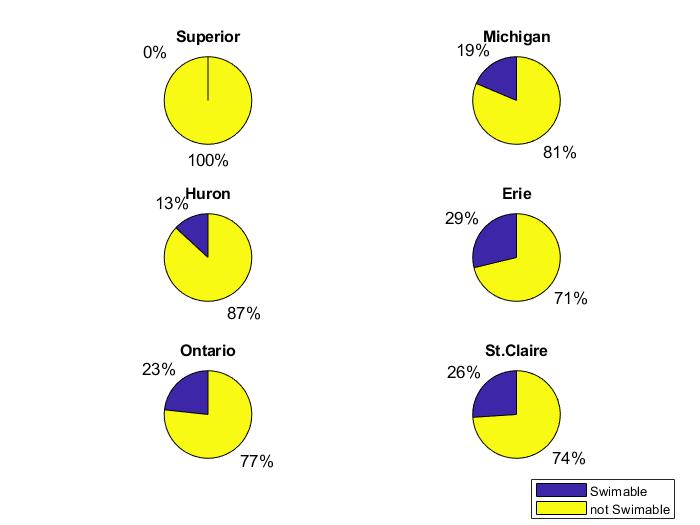
These 6 pie charts represent the percentage of the number of days in 2018 that each of the six lakes have an average temperature above 20°C .
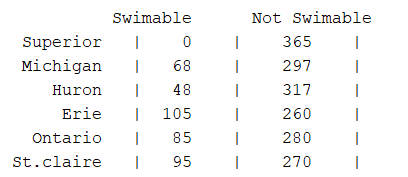
This graph is our favourite graph because we both enjoy swimming and it displays a clear comparison between the six lakes and where you can most comfortably swim. The six lakes in comparison are Lake Ontario, Lake Erie, Lake Huron, Lake Michigan, Lake Superior and Lake St.Clair. They are fairly close to each other and it provides an interesting outlook on the difference in average temperature between these six lakes. It is easy to understand and compare the percentage of time that each of the six lakes are above 20°C in 2018 and provides information for those who enjoy swimming as to which lake is warm most often. It can be useful to people who have other interests such as boats, cottages, and fishing and can help them make educated decisions. The following table displays how many days in each year that each of the six lakes are both swimmable and non-swimmable.
The pie charts conclude that Lake Superior is non-swimmable year around, Lake Michigan is swimmable 19% of the year and non-swimmable 81% of the year and Lake Huron is swimmable 13% of the year and non-swimmable 87% of the year. Lake Erie is swimmable 29% of the year and non-swimmable 71% of the year, while Lake Ontario is swimmable 23% of the year and non-swimmable 77% of the year. Finally, Lake St.Claire is swimmable 26% of the year and non-swimmable 74% of the year. Overall, this graph is clear, useful and well presented.
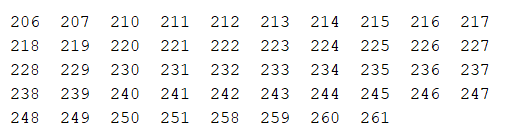
The days that you can swim in Lake Michigan are:
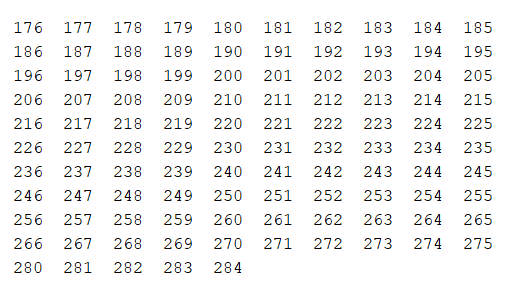
The days that you can swim in Lake Huron are:
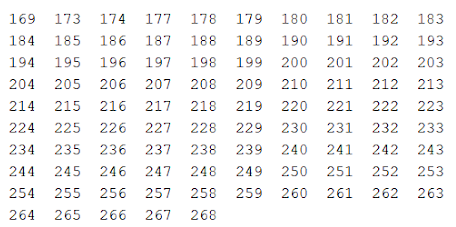
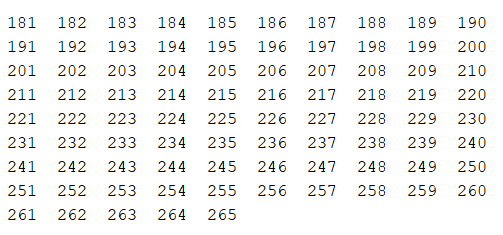
The days that you can swim in Lake Erie are:
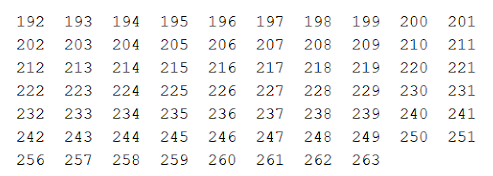
The days that you can swim in Lake Ontario are:
Finally, the days that you can swim in Lake St.Claire are: